Configuring Cisco Firepower Device Manager (FDM)
Overview
Use this guide if you manage a single Cisco Firepower Threat Defense (FTD) device or a small deployment. FDM is the on‑device web interface for configuring logging and Syslog.
Use FDM when:
-
You manage one FTD or a small number of devices.
-
You prefer on-device configuration without centralized policy management.
If you manage multiple devices or need centralized policies, refer to Configuring Cisco Firewall Management Center (FMC).
Step-by-step instructions
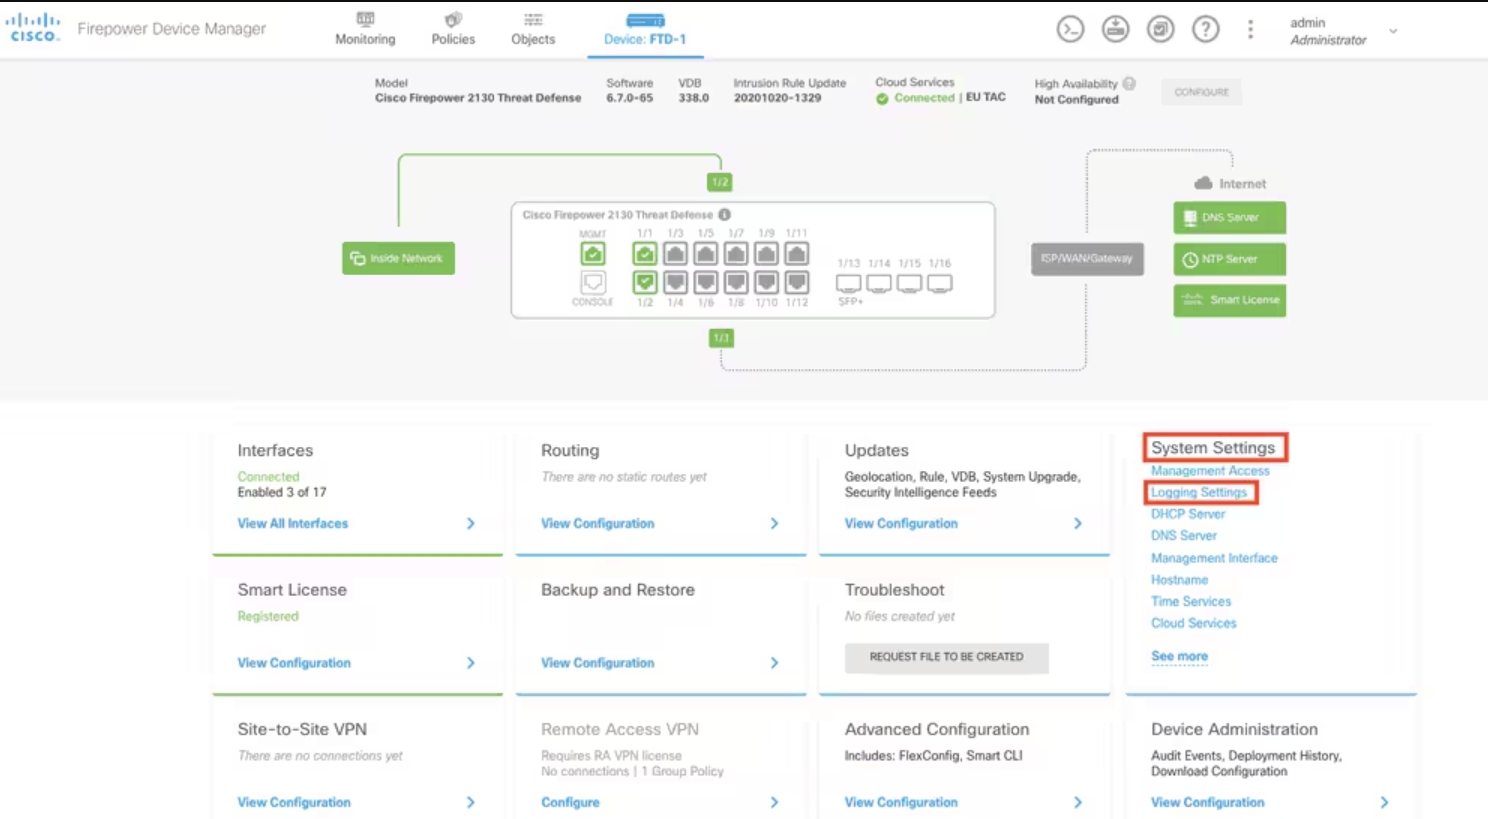
1. Access logging settings: From the main Firepower Device Manager screen, select Logging Settings under System Settings in the lower-right corner of the screen.
2. Navigate to logging configuration: On the System Settings page, select Logging Settings in the side navigation menu.
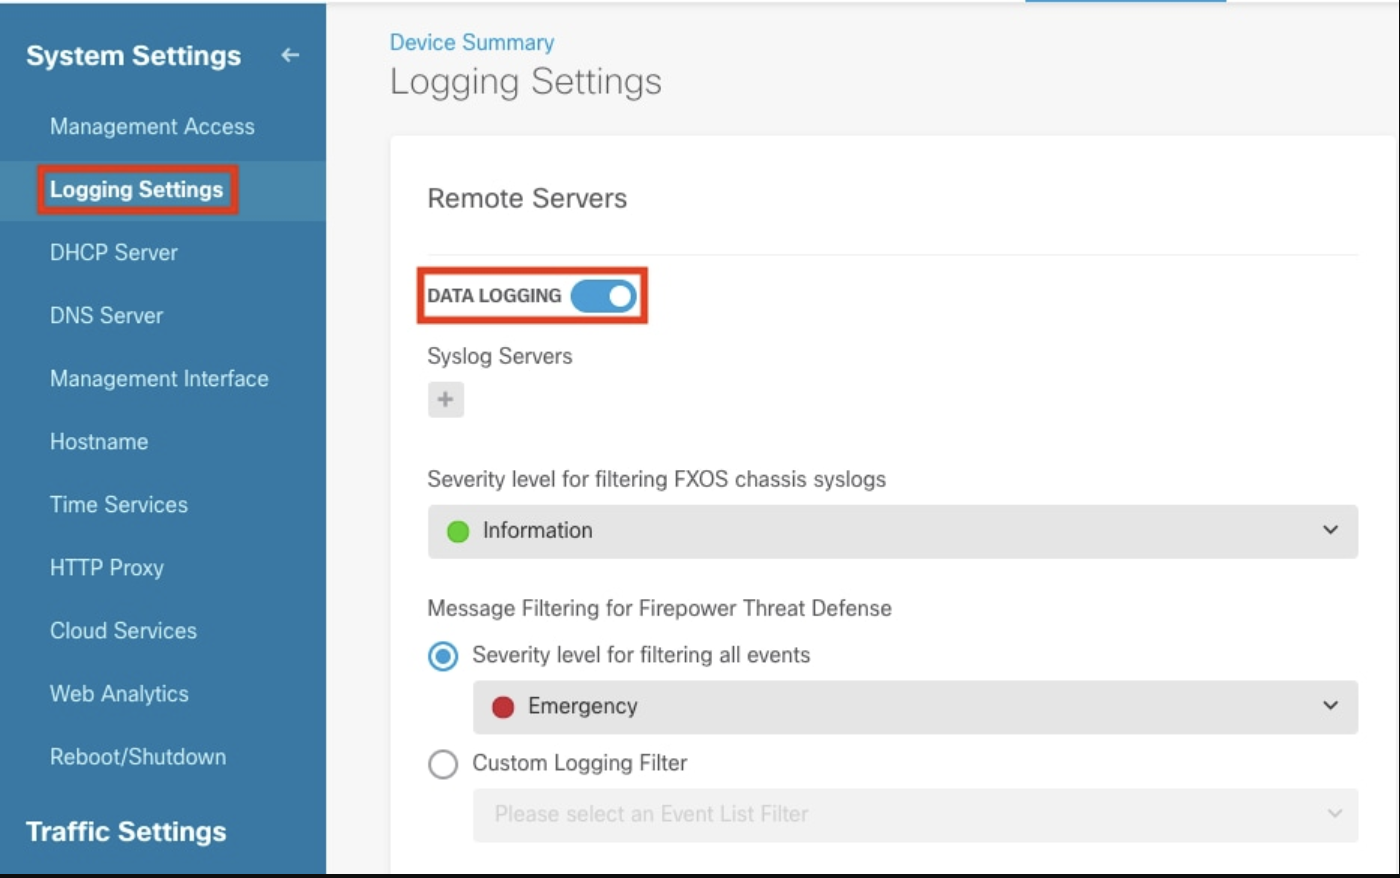
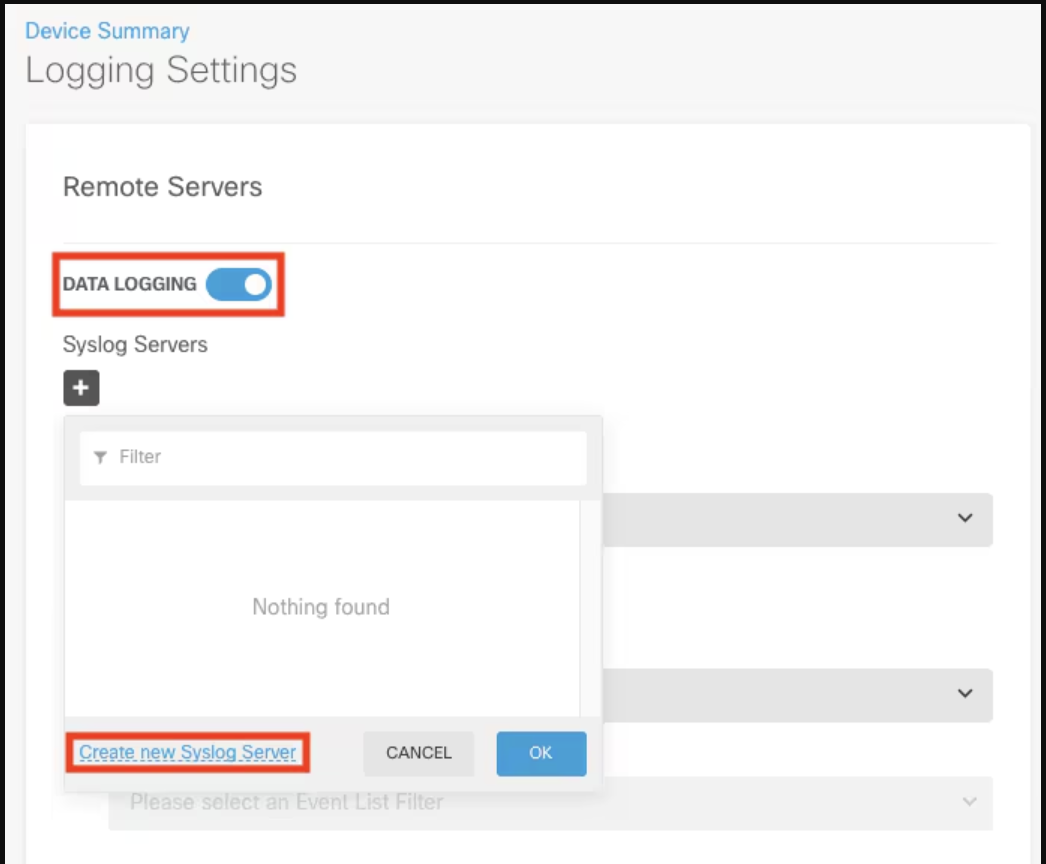
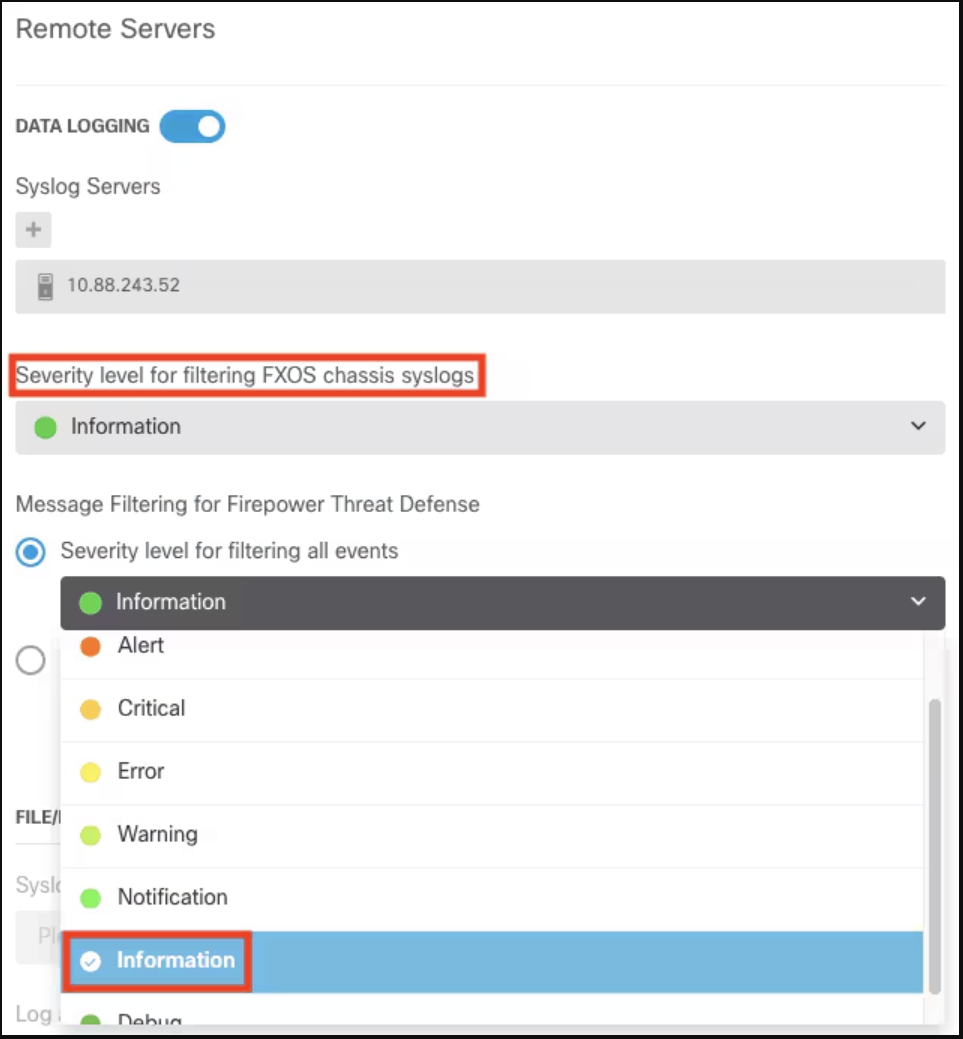
3. Enable data logging: Turn on the Data Logging toggle switch and click the + sign under Syslog Servers.
4. Add Syslog server: Click Create new Syslog Server. Alternatively, go to Objects > Syslog Servers and create the Syslog server object.
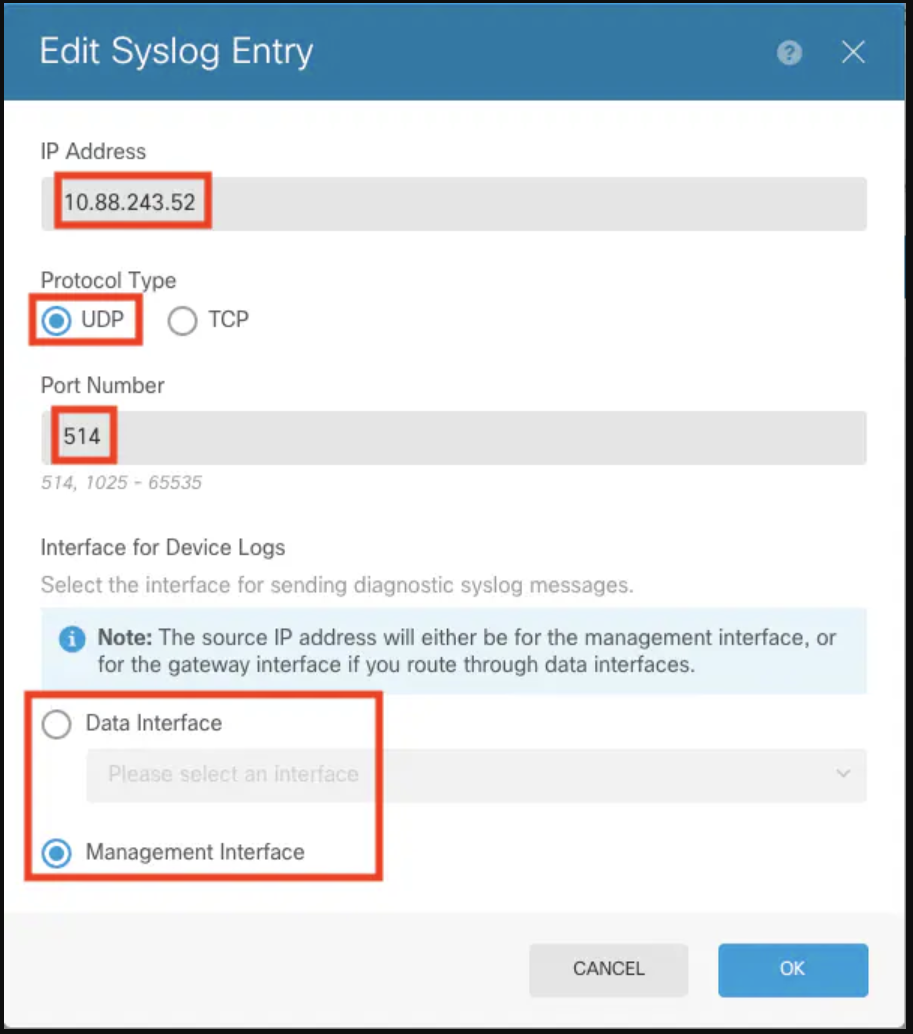
5. Enter server information: Input the IP address of your Syslog server and port number. Select Data Interface and click OK.
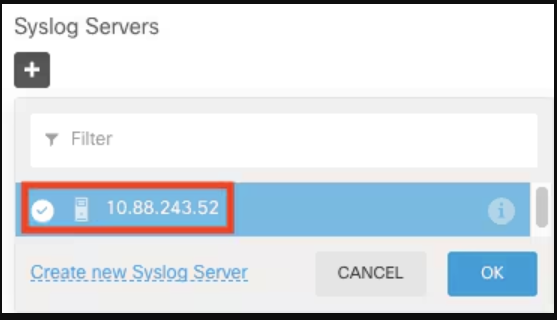
6. Finalize Syslog server addition: Select the newly added Syslog server and click OK.
7. Set severity level: Select Severity level for filtering all events and choose your desired logging level.
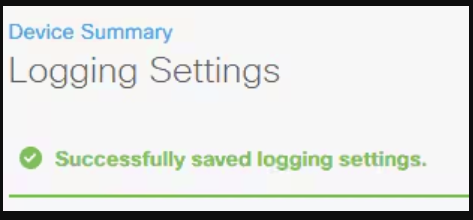
8. Save changes: Click Save at the bottom of the screen.
9. Verify settings: Verify that the settings reflect your new Syslog configuration.
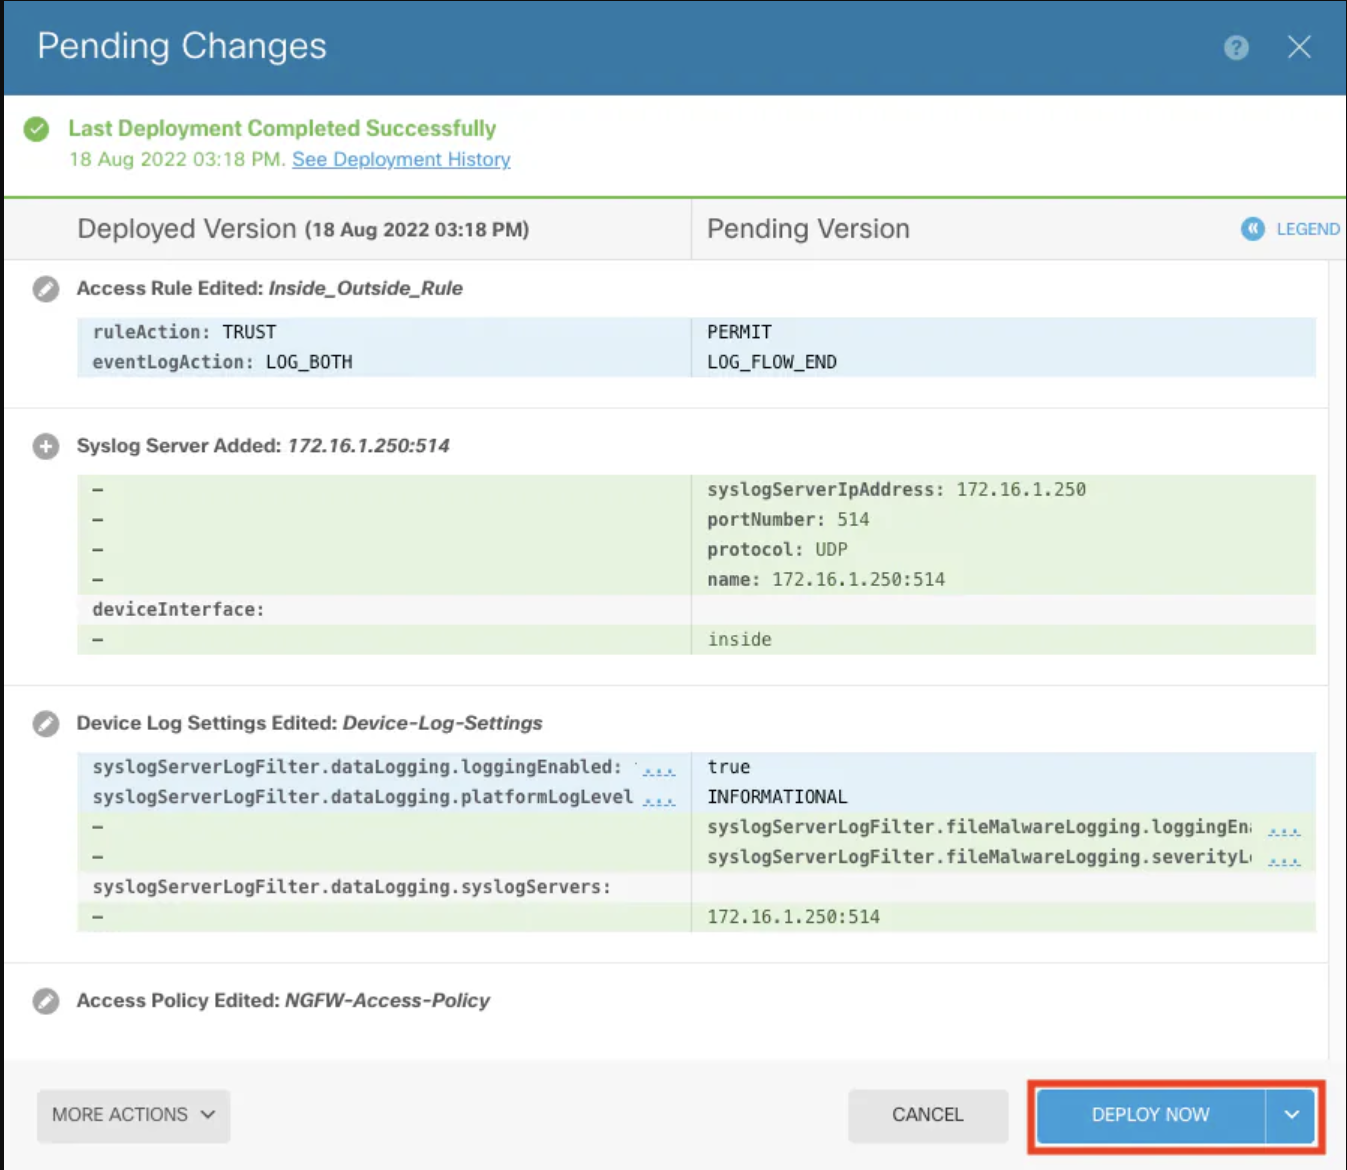
10. Deploy new settings: Click Deploy now to apply the new configurations.

(Optional) Log via Access Control Policy (ACP)
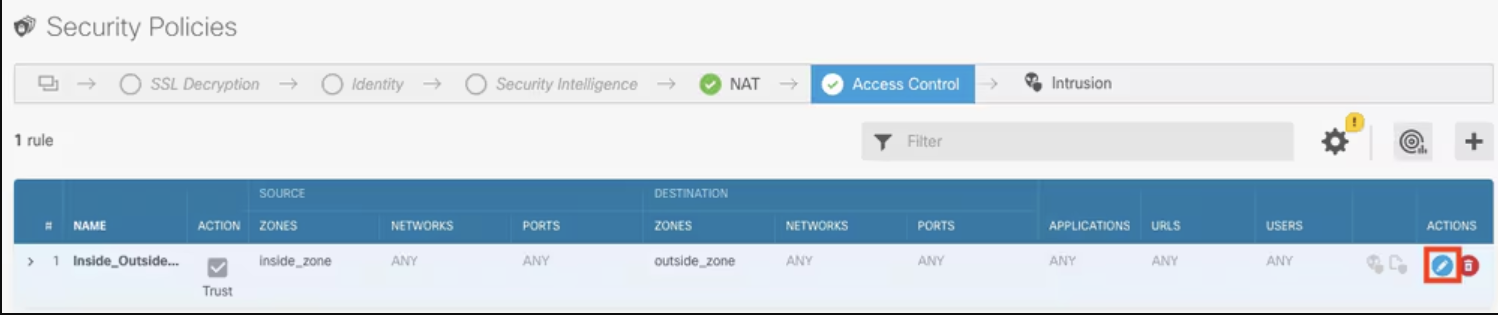
1. Open Policies: Click Policies in the top navigation.

2. Edit ACP rule: Hover over the target ACP rule and select the pencil icon.
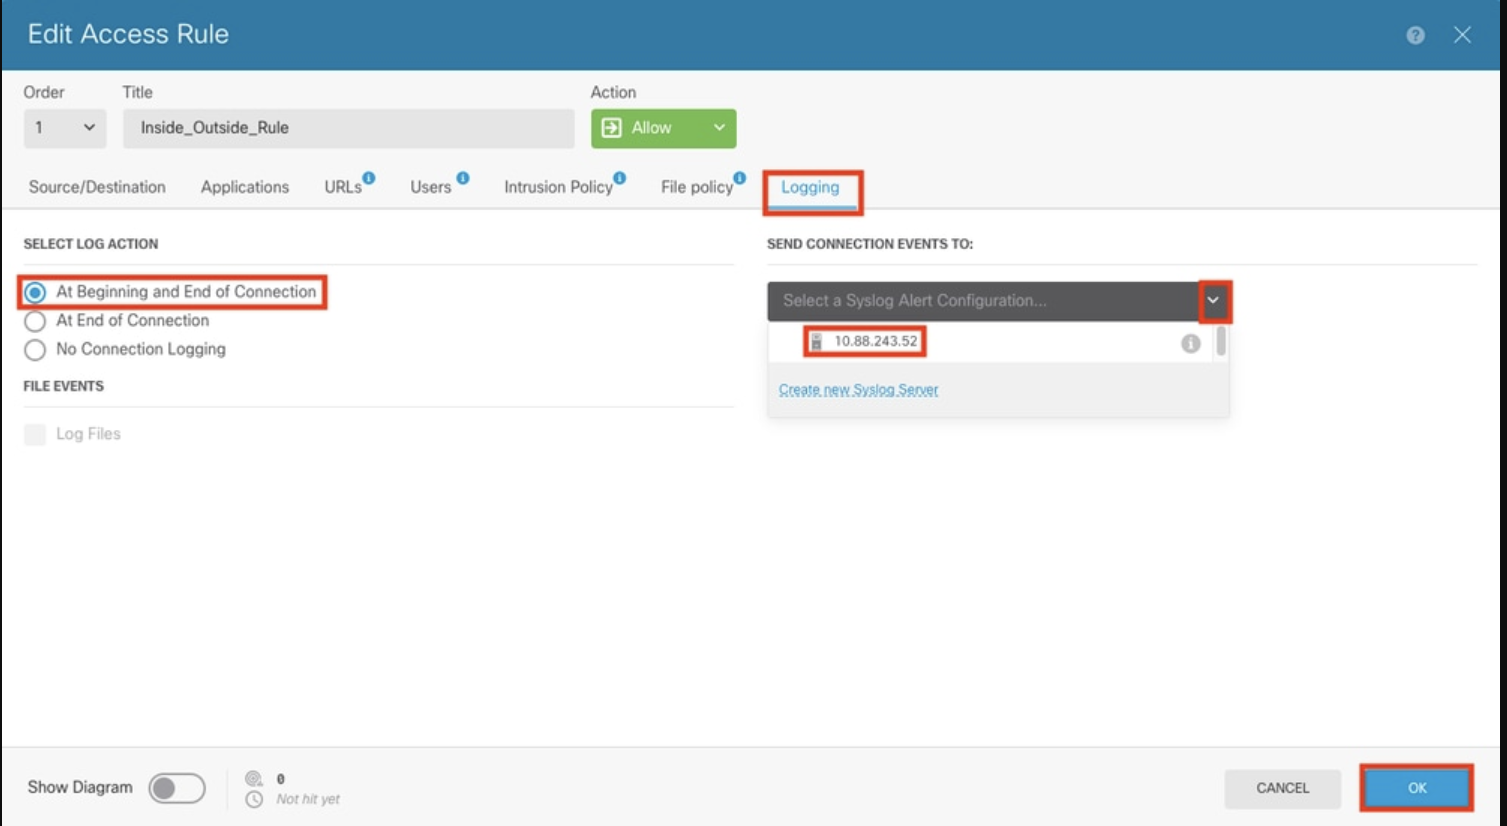
3. Configure logging: On the Logging tab, select At Beginning and End of Connection. Under Select a Syslog Alert Configuration, choose the Syslog server and click OK.
4. Deploy configuration changes: After configuring, deploy the changes to the ACP.
Verification in CLI
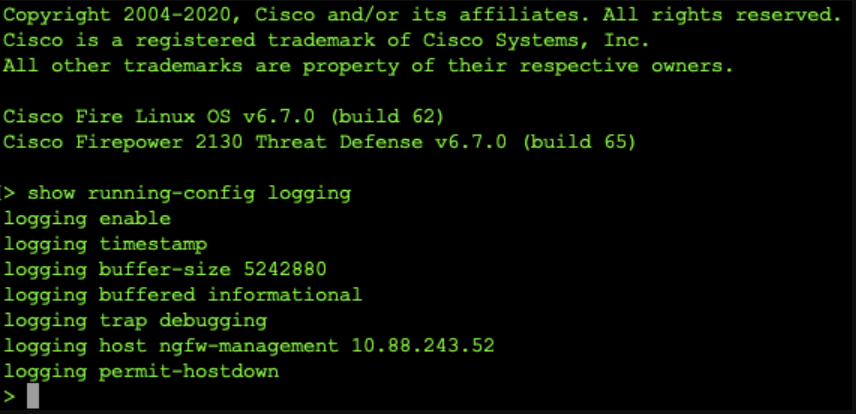
1. Check configuration in CLI: After the deployment task completes, verify the settings in the FTD CLI (Clish Mode) by using the command: `show running-config logging`.
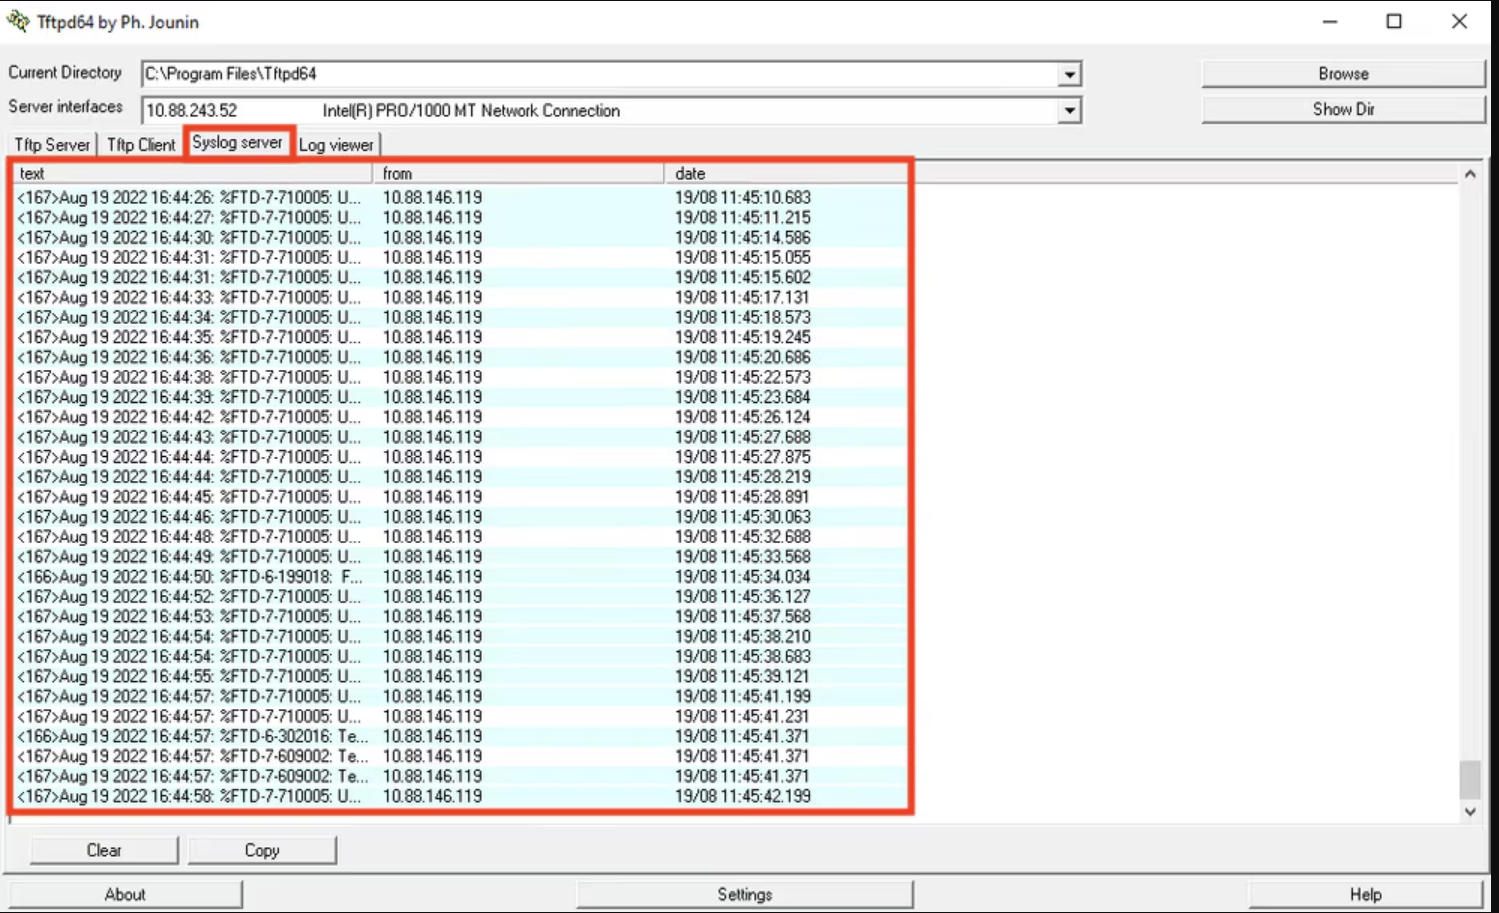
2. Verify Syslog server: Navigate to the Syslog server tab and check if the Syslog server application accepts the Syslog messages.
Troubleshooting
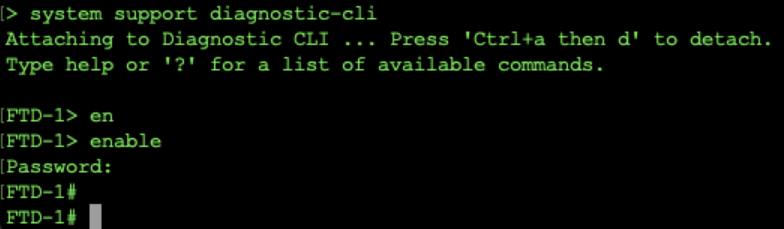
1. Check Syslog messages: If the Syslog application isn't displaying messages, perform a packet capture from the FTD CLI to inspect network traffic. Enter the command `system support diagnostic-cli` at the Clish prompt to switch from Clish mode to Lina.
2. Create packet capture: Set up a packet capture for UDP port 514 (or TCP port 1468 if you are using TCP).
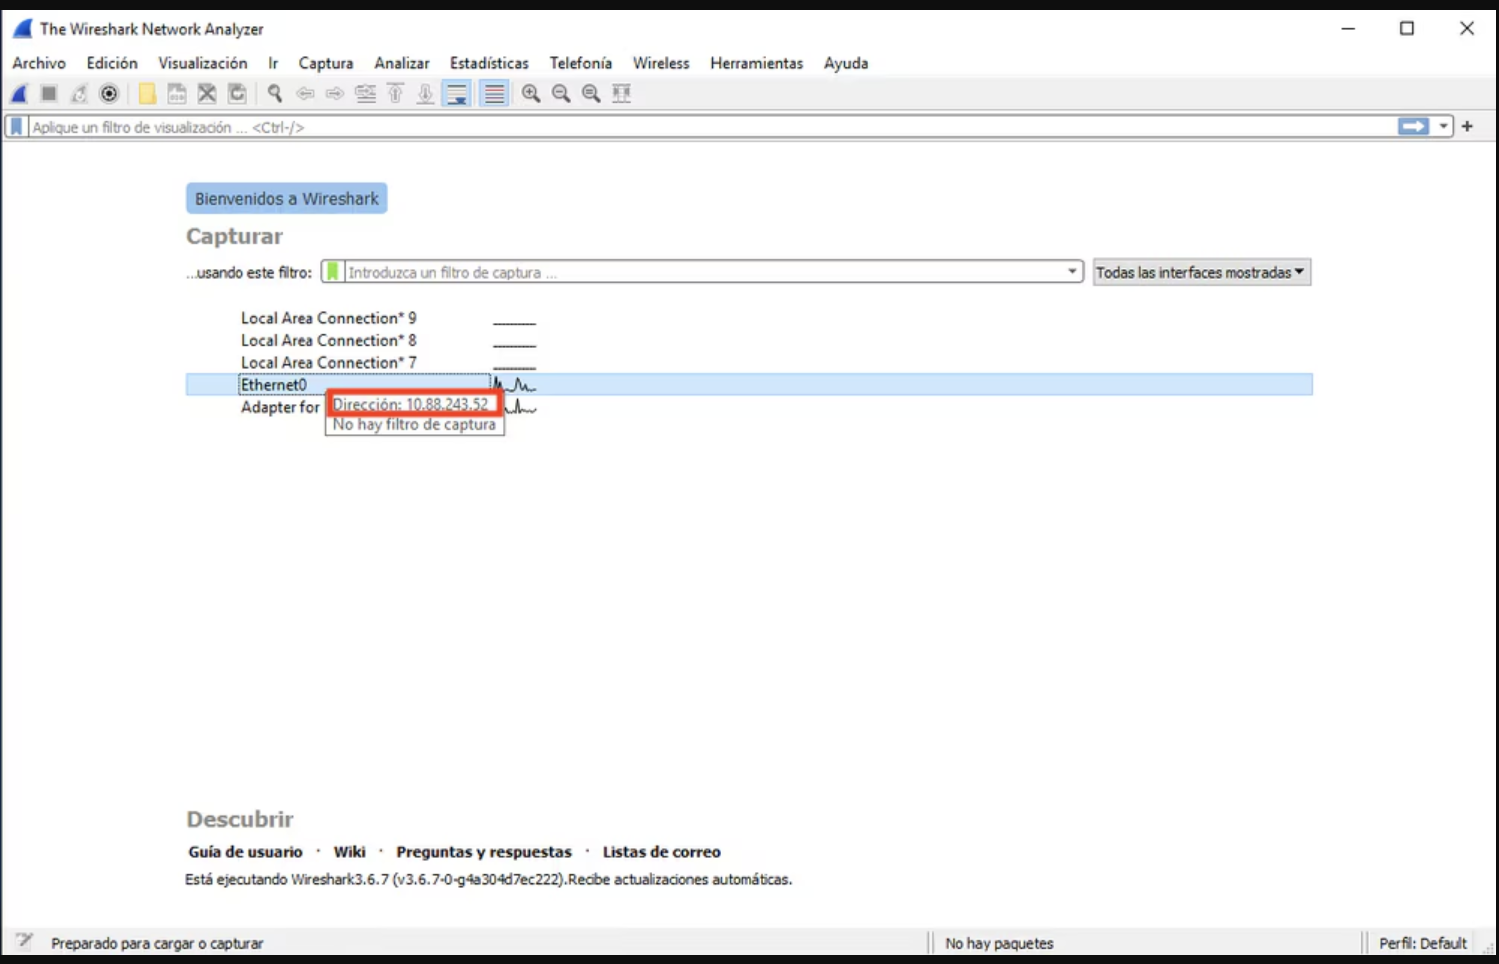
3. Verify communication: Ensure that packets are reaching the network interface card on the Syslog Server. Use Wireshark or a similar utility to start capturing packets. Double-click on the interface in Wireshark dedicated to the Syslog Server.
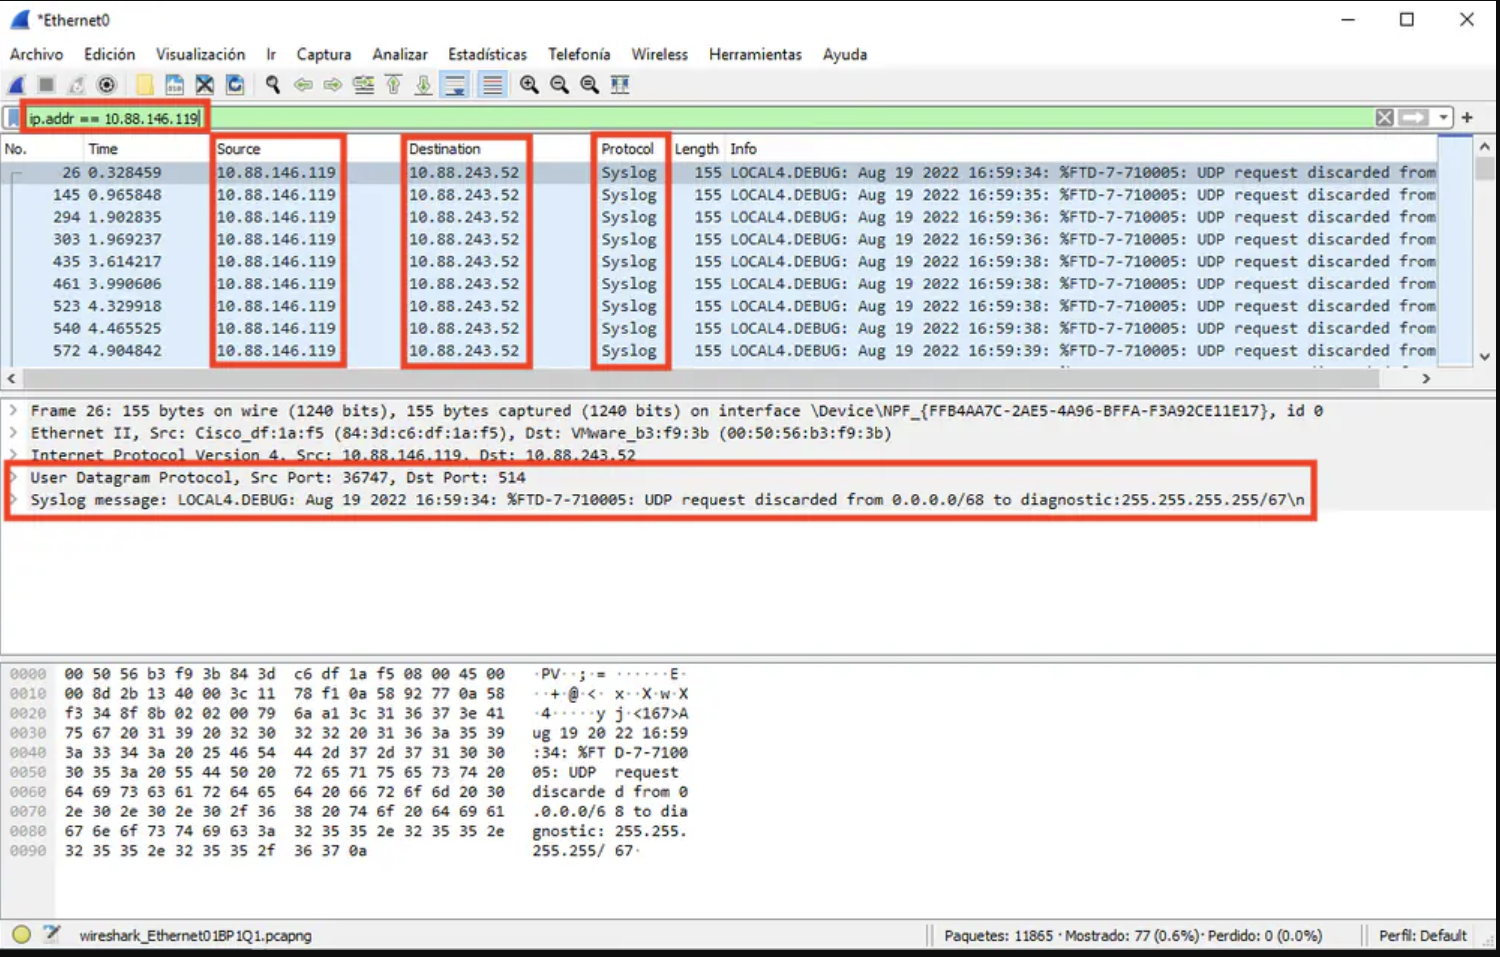
4. Set Wireshark display filter: In Wireshark, set a display filter for UDP 514 by typing `udp.port==514` in the top bar and click the arrow to apply the filter. Check the output to confirm that packets are reaching the Syslog Server.
5. Troubleshoot Syslog server application: If the Syslog application does not show any data, review the settings within the Syslog server application. Ensure that the correct protocol (UDP/TCP) and the appropriate port (514/1468) are configured correctly.
This guide should help you effectively set up and troubleshoot Syslog on Cisco Firepower.


